Methodology
Envisioning Seneca Village imagines how Seneca Village might have appeared two years before its destruction in 1857. No photos or drawings of the village survive. So, to build our 3D, our team integrated decades of historical and archaeological research with digital mapping methods, combining cartographic and social history with geographic information systems (GIS) and 3D modeling software. This page explains our process. A visual summary of the workflow is included at the end of this page.
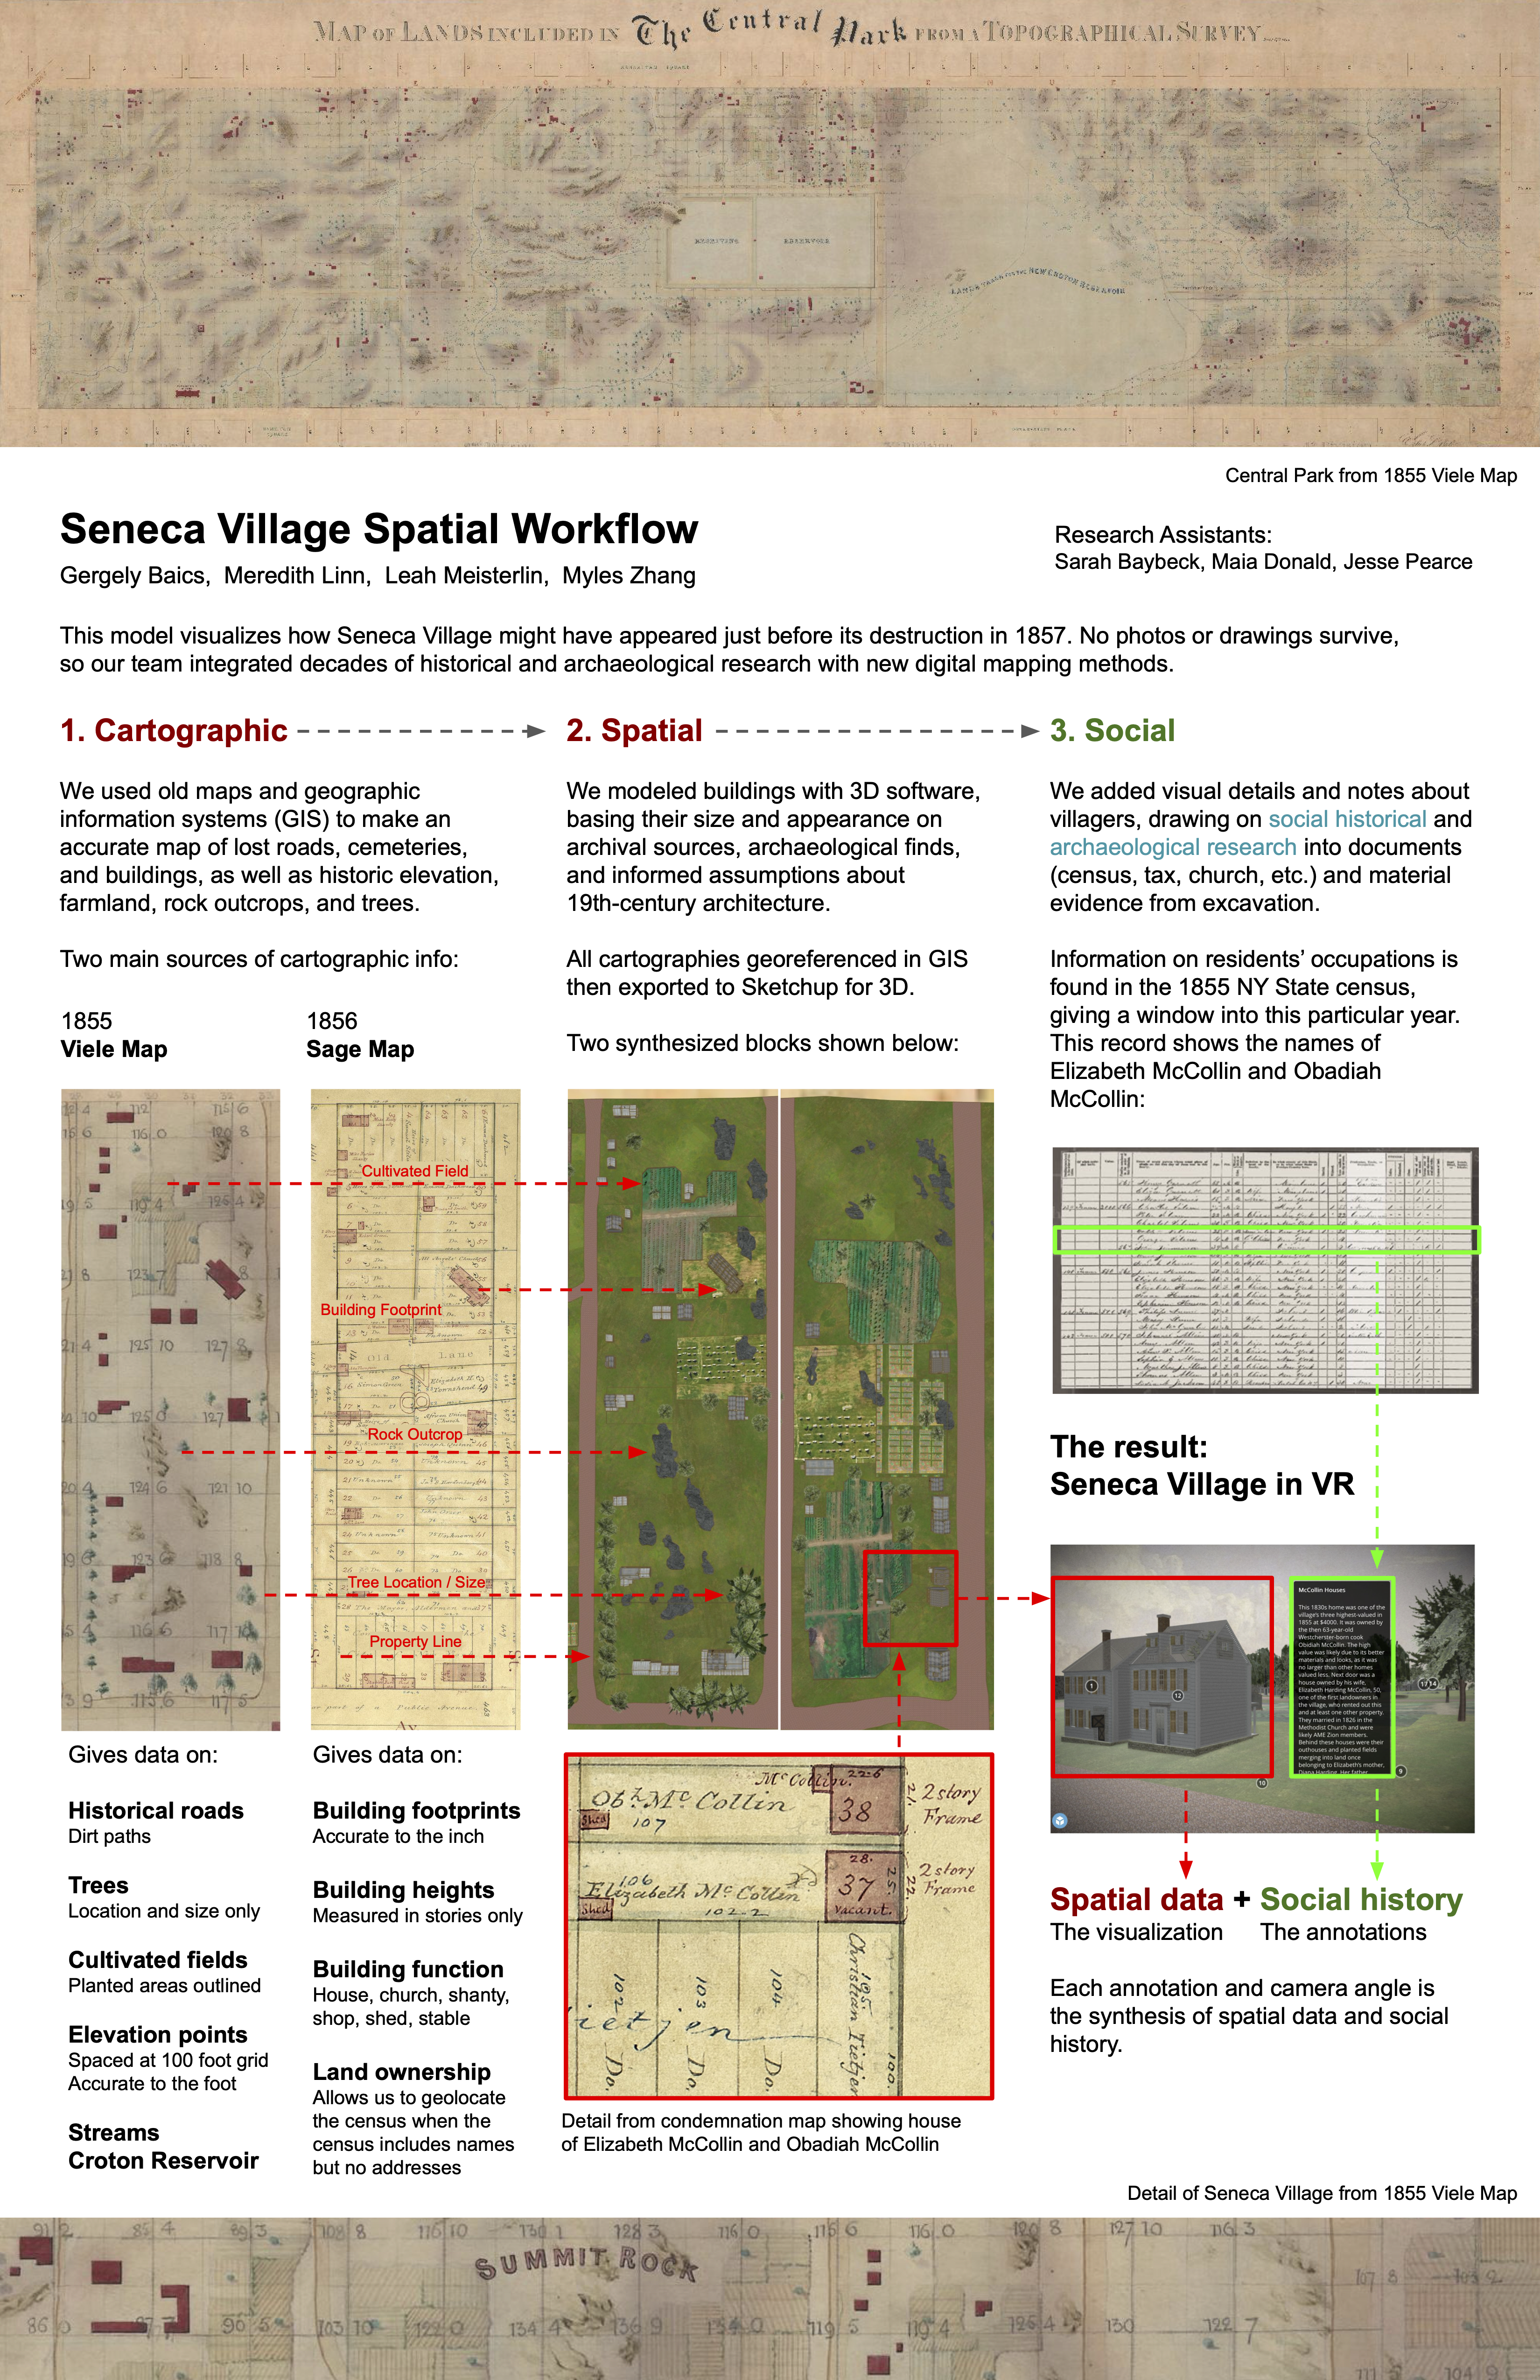
Digitizing and Combining Cartographic Sources
Our team used historical maps and geographic information systems (GIS) to create an accurate digital map of lost roads, cemeteries, and buildings as well as historical topography, farmland, rock outcrops, and trees. Our cartographic sources are included in the References list.
Two of our main sources of cartographic information were the 1855 Viele Map and the 1856 Sage Map. Both maps were commissioned to survey all the lands (from 59th to 106th Streets and 5th to 8th Avenues) the City would take with eminent domain to build the park. We focused on the area of Seneca Village, between 82nd and 86th Streets and 7th and 8th Avenues. The Viele Map includes information about roads and paths, locations and sizes of trees, and streams. It also outlines the areas of planted and cultivated fields and provides topographic elevation measurements. The Sage Map was originally created to detail property information, and thus it contains more information about specific buildings and identifies landowners and house occupants. This map depicts detailed building footprints labeled with dimensions in feet, number of stories, construction material (all “frame” in Seneca Village), and type, such as houses, churches, sheds, barns, and stables.
Briefly, the process of digitizing these sources was as follows: Scanned maps were georeferenced (given digital coordinates that correspond to physical locations). Then, individual features of these georeferenced maps were digitally traced. In this process, building footprints were also outlined, tree locations recorded, roads drawn, and all other physical information translated into a digital map.
Spatializing and Visualizing the Digital Map in 3D
We then visualized the 2-dimensional digital map in 3D, adding materials and other details, with 3D modeling software. Much of the basic information needed for the model was found in the historical map sources. For example, building sizes and heights (which we based on the number of stories) are labeled on the Sage Map. Likewise landforms and rock outcroppings were modeled from elevation points digitized from historical sources and topographical contours in contemporary surveys. Other decisions involved combining information from archival sources and archaeological finds. These sources are included in our References list.
Still, modeling the Village required speculation and making informed assumptions. These assumptions were supported by a variety of factors and sources, including New York’s 19th-century architectural history, the variation in declared value of different properties, and input from many of the researchers and scholars who have studied Seneca Village. A detailed list of these assumptions can be found in our Speculations and Assumptions page.
Because our map sources are more detailed at ground level, the model is more certain near the ground than at its rooftops. We have attempted to indicate the gradient between historical and archaeological records and informed speculation with differing levels of opacity in the rendering of buildings. The model is more opaque where greater levels of evidence confirm our choices and more transparent where an educated imagination must fill in the gaps.
Adding the Social Dimension
Of course, Seneca Village was not an empty place before its destruction. Instead, it was a community of families with people of all ages who engaged in different kinds of labor-intensive work, came from a variety of backgrounds, and had a little more or a little less economic success. To convey the vibrant life within the village, we added visual details and notes about the villagers, drawing on social historical and archaeological research. These included census, church, and tax records as well as material evidence from excavation. Aspects of the material and social dimensions of life within Seneca Village are described in the model’s annotations as well as its visualization.
For example, the 1850 Federal Census and the 1855 New York State Census include lists of individuals living in each home and their occupations. (Note that neither of these censuses include addresses, so multiple sources, especially the 1856 Sage map, are needed to determine which families in a particular city ward lived in Seneca Village and in which house.) Several occupations require specific tools or equipment that would have been present. Similarly, the number of children across the village contributes to the model in the form of games and toys. And, as families today still know, large families generate more laundry.
The model also aims to indicate how everyday life would have influenced the appearance of the village. Spaces of congregation, such as churches and schools, or other areas with greater foot traffic are reflected on the ground. Wells indicate the necessary everyday activity of gathering water at its sources. And animals, along with the fencing they require, speak to both sustenance activities and work.
Visual Summary